
Executive Summary
NetLink NBN Trust (SGX: CJLU) occupies a unique position in Singapore’s equity market. As the owner and operator of the nation’s passive fibre network, it functions more like regulated infrastructure than a traditional growth business. Its cash flows are stable, demand is largely recession-proof, and its distributions have historically appealed to income-focused investors seeking predictability.
However, recent developments have complicated the narrative. Accounting profits have declined, costs have risen, and yields have compressed to around 5.5%, prompting renewed scrutiny over dividend sustainability and valuation. This article examines NetLink’s business model, cash-flow dynamics, regulatory framework, and key risks to assess whether its role as a defensive income anchor remains justified in the current interest-rate environment.
Understanding the Business Model: Infrastructure, Not Technology
NetLink NBN Trust owns and operates Singapore’s passive fibre network infrastructure. Its role is analogous to a toll-road operator for data: it does not sell broadband services directly to consumers, but instead leases fibre connections to Retail Service Providers (RSPs) such as Singtel, StarHub, M1, and MyRepublic.
Revenue is derived from two main segments:
Regulated Asset Base (RAB)
Approximately 85% of revenue comes from assets governed by price controls set by the Infocomm Media Development Authority (IMDA), reviewed every five years.
- Residential connections account for roughly 60% of total revenue, with a regulated monthly fee of S$13.50 per connection.
- Non-residential connections (offices, schools, malls, data centres) contribute around 8% of revenue, priced at S$55 per month.
- Non-Building Access Points (NBAPs)—supporting smart-city infrastructure such as traffic lights, sensors, and outdoor 5G base stations—add roughly 4–5% of revenue and represent the main avenue for incremental growth.
Non-RAB revenue
The remaining 15% includes installation fees, ancillary infrastructure projects, and leasing of central-office space. While smaller, this segment provides limited commercial flexibility beyond the regulated core.
This structure makes NetLink highly predictable, but also constrains pricing power and growth.
Financial Performance: Profit Decline Versus Cash Stability
At first glance, recent results appear concerning. For the nine months ended December 2025 (9M FY2026), profit after tax fell 11.8% year-on-year to S$65.4 million.
However, headline profit is not the most relevant metric for a capital-intensive infrastructure trust.
Revenue trends have remained stable:
- FY2024 revenue: S$411.3 million
- FY2025 revenue: S$407.0 million
- 9M FY2026 revenue: S$313.0 million (+1.6% year-on-year)
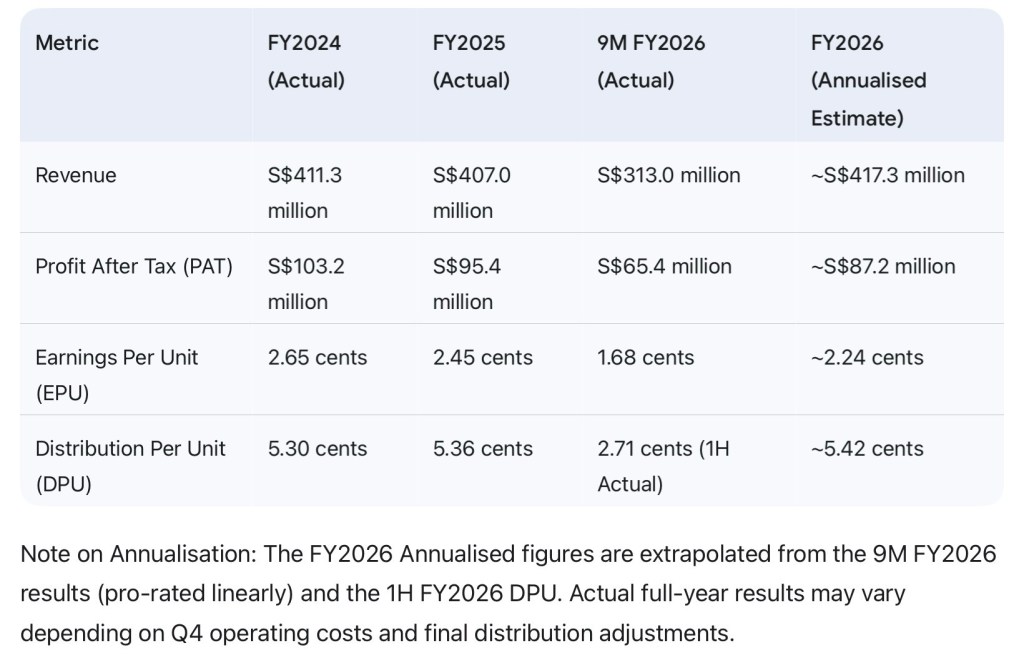
The decline in reported profit is driven largely by higher depreciation and finance costs. Depreciation rose following the completion of the Seletar Central Office, while higher interest rates increased financing expenses. Importantly, depreciation is non-cash, meaning it reduces accounting earnings but does not affect actual cash generation.
Why Earnings and Distributions Diverge
A recurring source of confusion among investors is the gap between earnings per unit (EPU) and distribution per unit (DPU).
In the first half of FY2026, NetLink reported:
- DPU: 2.71 cents
- EPU: 1.11 cents
This apparent payout ratio above 200% is not indicative of financial stress. As a business trust, NetLink distributes based on distributable cash flow, not accounting profit.
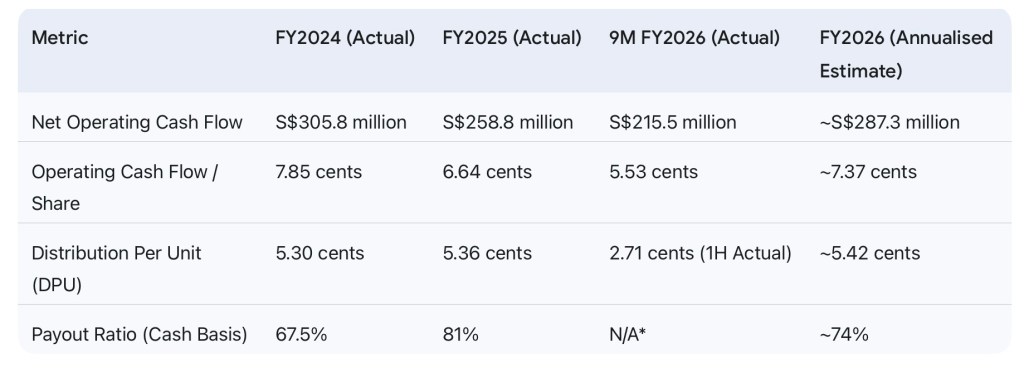
Annualised operating cash flow for FY2026 is approximately 7.37 cents per unit, comfortably covering an expected annual DPU of around 5.4 cents. The distributions are therefore supported by operating cash collected from RSPs, rather than debt or asset sales.
A Narrowing Buffer: The Real Issue to Watch
While distributions remain covered, the margin of safety has tightened over time.
- FY2024 operating cash flow per unit: ~7.85 cents
- FY2025: ~6.64 cents
- FY2026 (annualised): ~7.37 cents
The moderation reflects rising operating costs, particularly:
- Higher property taxes on newly completed infrastructure
- Increased IT, maintenance, and cybersecurity expenses
- Elevated finance costs during the high-rate period
The counterbalance lies in capital expenditure. NetLink has completed its major Seletar Central Office project, which absorbed roughly S$110 million over recent years. Management has indicated that future capex should moderate, shifting from heavy build-out to maintenance mode. Lower capex helps stabilise free cash flow even as operating costs rise.
Key Structural Risks
Despite its defensive profile, NetLink is not risk-free.
Interest-rate sensitivity
NetLink functions as a bond proxy. Higher risk-free yields reduce the relative attractiveness of its distributions. While 100% of debt is now hedged at fixed rates and average maturity has been extended to 3.7 years, refinancing risk will re-emerge over time if rates remain elevated.
Regulatory constraints
IMDA-set pricing limits NetLink’s ability to offset inflation. The latest regulatory review reduced residential and NBAP pricing while holding non-residential rates flat. Until the next review in 2029, growth must come from volume rather than price.
Substitution risk at the margin
The rise of 5G fixed-wireless broadband introduces a low-probability but non-zero risk. A sustained decline in residential fibre connections—currently stable at around 1.5 million—would challenge the investment thesis.
Role Within an Income Portfolio
NetLink is best understood as a portfolio stabiliser rather than a return driver. Its characteristics resemble a high-quality corporate bond with limited growth optionality. Potential upside exists if interest rates decline meaningfully, which would likely prompt yield compression and capital appreciation. Conversely, a prolonged high-rate environment could leave returns largely confined to distributions.
At current yield levels around 5.5%, the risk premium over government securities is modest. This places greater emphasis on entry price and opportunity cost rather than dividend safety alone.
Conclusion
NetLink NBN Trust remains one of the most defensive income vehicles in Singapore’s equity market. Its monopoly infrastructure, regulated cash flows, and predictable demand continue to underpin distribution stability. However, slower growth, rising costs, and interest-rate sensitivity limit upside and compress valuation support.
For income-focused investors, NetLink’s appeal lies less in excitement and more in resilience. Its suitability ultimately depends on whether stability and capital preservation are prioritised over higher—but less predictable—yields elsewhere.
How This Analysis Fits Within a Broader Research Framework
This article forms part of an ongoing research series examining Singapore-listed REITs and income-oriented investments through the lens of asset quality, income sustainability, capital discipline, and portfolio role. The objective is to provide structured, long-term analysis rather than commentary on short-term price movements.
Related Research
• Singapore REITs 2026 Guide
• Core–Satellite REIT Portfolio Framework
• Dividend Investing & Income ETFs — Structural Overview
Publication note: This article is intended for educational and informational purposes and reflects publicly available information as at the date of publication.

Leave a comment