
Executive Summary
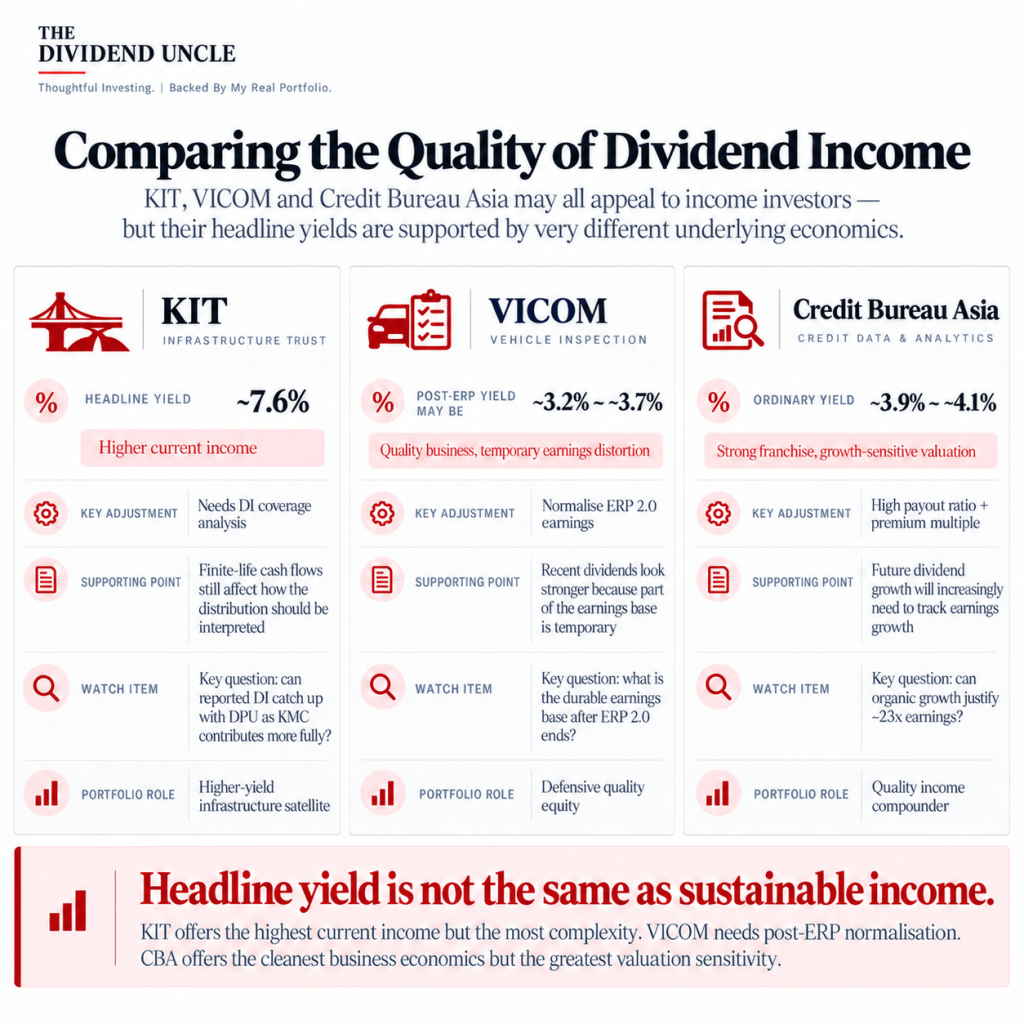
Keppel Infrastructure Trust or KIT (SGX: A7RU), VICOM (SGX: WJP) and Credit Bureau Asia or CBA (SGX: TCU) all appeal to income investors, but their headline yields are driven by very different economics. KIT’s yield requires adjustment for distribution coverage and finite-life cash flows; VICOM’s recent dividend is supported partly by temporary ERP 2.0 earnings; and CBA’s roughly 4% ordinary yield comes from a capital-light franchise where the payout ratio is already high.
The key comparison is therefore not which security offers the highest headline yield, but which income stream is most durable and what must happen for it to grow. On that basis, KIT offers the highest current income but the greatest distribution-quality complexity, VICOM requires earnings normalisation, and CBA offers the cleanest underlying business economics but the greatest valuation sensitivity.
Three Income Stocks, Three Different Earnings Engines
| Company | Current income proposition | Main adjustment needed | Key forward question |
|---|---|---|---|
| KIT | ~7.6% annualised headline DPU yield | DI coverage and finite-life cash flows | Can reported DI catch up with DPU? |
| VICOM | Elevated FY2025/1H26 dividend | Normalise temporary ERP 2.0 earnings | What is post-ERP earnings power? |
| CBA | ~4% ordinary dividend yield | High payout ratio and premium valuation | Can earnings grow fast enough? |
These differences matter because a 7% infrastructure distribution, a 4% corporate dividend and a temporarily elevated project-driven payout cannot be assessed on yield alone.
The relevant framework is income quality first, headline yield second.
Income Quality: Why KIT’s 7.6% Requires More Interpretation
KIT’s portfolio has improved substantially over the past several years.
In FY2018, only about 29% of portfolio distributable income came from assets classified as evergreen. By FY2025, that figure had risen to 51%. At the same time, DI from the original portfolio fell from around S$141 million in FY2018 to S$81 million, while acquisitions since 2019 were contributing approximately S$169 million.
This is important because it shows that KIT did not eliminate the runoff of legacy income. It replaced declining income while changing the portfolio mix.
The current portfolio therefore combines evergreen operating businesses with longer-duration contracted infrastructure. That is structurally stronger than the historical trust, but it does not make every dollar of distribution economically perpetual.
KIT reported 1H2026 DI of S$101.1 million, and completed its acquisition of an additional 39% interest in Keppel Merlimau Cogen on 26 June 2026, lifting its interest to 90%. Management expects higher KMC contribution in 2H2026.
At a unit price around S$0.52, annualising the 1H2026 DPU of 1.99 cents gives a headline yield of about 7.6%.
But two additional lenses are useful:
- annualising reported 1H2026 DI produces an implied yield of roughly 6.4%;
- reversing only the identifiable concession-and-lease-receivable add-back produces a more conservative sensitivity of roughly 5.8%.
The 5.8% figure should not be interpreted as a definitive “true yield”. It is a sensitivity designed to show that some contractual cash flows include recovery of finite-life economic assets.
The next reporting periods are therefore important. If the enlarged KMC stake lifts DI sufficiently for coverage to move closer to the declared distribution, KIT’s income-quality case strengthens materially.
The more important KPI is no longer simply AUM growth. It is sustainable DI per unit, DPU coverage and balance-sheet capacity.
Earnings Durability: VICOM’s Recent Strength Needs Normalisation
VICOM presents a different problem.
Its core vehicle-inspection business appears more durable than a simple EV-disruption thesis suggests. Mandatory inspection is a regulatory function rather than a vehicle-maintenance function, so lower EV servicing requirements do not automatically imply lower inspection demand.
The key earnings issue is instead ERP 2.0.
VICOM’s PATMI rose from S$29.3 million in FY2024 to S$42.5 million in FY2025, while EPS increased from 8.26 cents to 11.98 cents. FY2025 revenue reached S$167.4 million, with VICOM stating that the increase was mainly due to the OBU installation project. Management also described the project as one-off in nature.
This means trailing earnings overstate steady-state profitability.
A useful way to frame post-ERP earnings is through scenarios rather than a single forecast.
Using FY2024 PATMI as a pre-ERP anchor, a post-ERP PATMI range of roughly S$30 million to S$34 million would imply EPS of approximately 8.5 to 9.6 cents.
At a share price around S$1.83, that would place VICOM on roughly 19–22 times normalised earnings.
Assuming a 70% payout ratio purely for illustration, the corresponding dividend yield would be about:
- 3.2% at S$30 million PATMI;
- 3.4% at S$32 million;
- 3.7% at S$34 million.
That makes the key income question clear.
VICOM’s current dividend looks attractive partly because recent earnings include temporary ERP contribution. Once that disappears, the sustainable yield could move into the low-to-mid 3% range unless the underlying testing business expands meaningfully.
That puts greater emphasis on SETSCO and the new Jalan Papan testing hub. VICOM has been extending testing capabilities into areas such as medical devices, consumer electronics and industrial equipment, with Jalan Papan expected to become fully operational in 2H2026.
The investment case therefore shifts from EV disruption to post-ERP earnings durability and the ability of non-vehicle testing to lift the normalised base.
Capital Efficiency vs Reinvestment: Why CBA Is Different
CBA has arguably the strongest underlying business economics of the three.
The core credit-bureau model is asset-light and benefits from regulation, accumulated data, member participation and integration into financial institutions’ credit processes. These characteristics support high capital efficiency and relatively low financial risk.
But high capital efficiency creates a different problem: how much capital can be reinvested productively?
CBA’s June 2026 capital reduction is revealing. The company returned 9 cents per share, or roughly S$20.7 million, after management considered acquisitions, greenfield expansion and other uses but did not identify sufficiently attractive opportunities.
This reflects good capital discipline. Returning surplus cash is preferable to forcing value-destructive expansion.
But it also highlights an important distinction:
High return on capital is not the same as high reinvestment capacity.
CBA does not need large amounts of capital to launch additional analytics, scoring or monitoring products. Organic growth can therefore continue without large balance-sheet deployment.
However, if major reinvestment opportunities remain scarce, future value creation increasingly depends on organic earnings growth plus disciplined capital returns.
That matters because CBA is not valued like a low-growth utility.
Its FY2025 PATMI was about S$10.7 million, while the latest 1H2026 interim dividend was 2.2 cents.
At around S$1.08 per share, CBA trades near 23 times trailing earnings. Its FY2025 ordinary dividend of 4.2 cents equates to a yield of roughly 3.9%. If the 2.2-cent interim dividend were simply matched in the second half—not a forecast—the annual payout would reach 4.4 cents, or about 4.1%.
That is a respectable yield for a high-quality, capital-light business.
The constraint is the payout ratio. With a large proportion of earnings already distributed, future dividend growth increasingly has to track earnings growth rather than payout expansion.
Portfolio Role Comparison
The three securities therefore occupy very different conceptual roles.
| Company | Conceptual role | Principal strength | Principal constraint |
|---|---|---|---|
| KIT | Higher-yield infrastructure satellite | Income and non-property diversification | Distribution coverage / reinvestment |
| VICOM | Defensive quality equity | Regulated core franchise | Lower normalised post-ERP yield |
| CBA | Quality income compounder | Moat and capital efficiency | Premium valuation / modest growth |
KIT offers the greatest immediate income but requires the most interpretation.
VICOM provides a defensive operating franchise, but normalised yield appears less compelling once temporary project earnings are removed.
CBA offers the cleanest business model, but much of that quality is already recognised in the valuation.
Key Risks & Mitigating Factors
- KIT distribution coverage: Reported DI did not fully cover the declared 1H2026 distribution. The enlarged KMC contribution is a meaningful mitigating factor, but normalised coverage still needs to be demonstrated.
- KIT capital allocation: The trust has successfully replaced legacy income, but future acquisitions and recycling must create value per unit rather than simply increase scale.
- VICOM earnings normalisation: ERP 2.0 temporarily raises the earnings base. SETSCO growth and the Jalan Papan ramp-up could soften the decline, but the steady-state contribution remains uncertain.
- VICOM regulatory dependence: Regulation supports inspection demand but can also alter frequency, scope, pricing and competitive structure.
- CBA valuation and growth: A premium multiple leaves less room for sustained low-single-digit earnings growth. Stronger organic growth would make the dividend-growth proposition more compelling.
The Dividend Uncle Research View
KIT has improved most structurally and now offers a more credible higher-yield infrastructure proposition, but distribution coverage remains the key test.
VICOM’s core inspection franchise appears more durable than an EV-disruption thesis suggests, although its current earnings and dividend require substantial post-ERP normalisation.
CBA has the strongest underlying capital efficiency and business quality, but its premium valuation means modest growth is less easily overlooked.
The central conclusion is therefore not that one stock has the “best yield”. It is that headline yield, sustainable income and valuation need to be analysed separately. For long-term income investors, the quality of the earnings supporting the distribution matters at least as much as the percentage yield itself.
How This Analysis Fits Within a Broader Research Framework
This article forms part of an ongoing research series examining Singapore-listed REITs and income-oriented investments through the lens of asset quality, income sustainability, capital discipline, and portfolio role. The objective is to provide structured, long-term analysis rather than commentary on short-term price movements.
Related Research
• Singapore REITs 2026 Guide
• Core–Satellite REIT Portfolio Framework
• Dividend Investing & Income ETFs — Structural Overview
Publication note: This article is intended for educational and informational purposes and reflects publicly available information as at the date of publication.


Leave a Reply