
Executive Summary
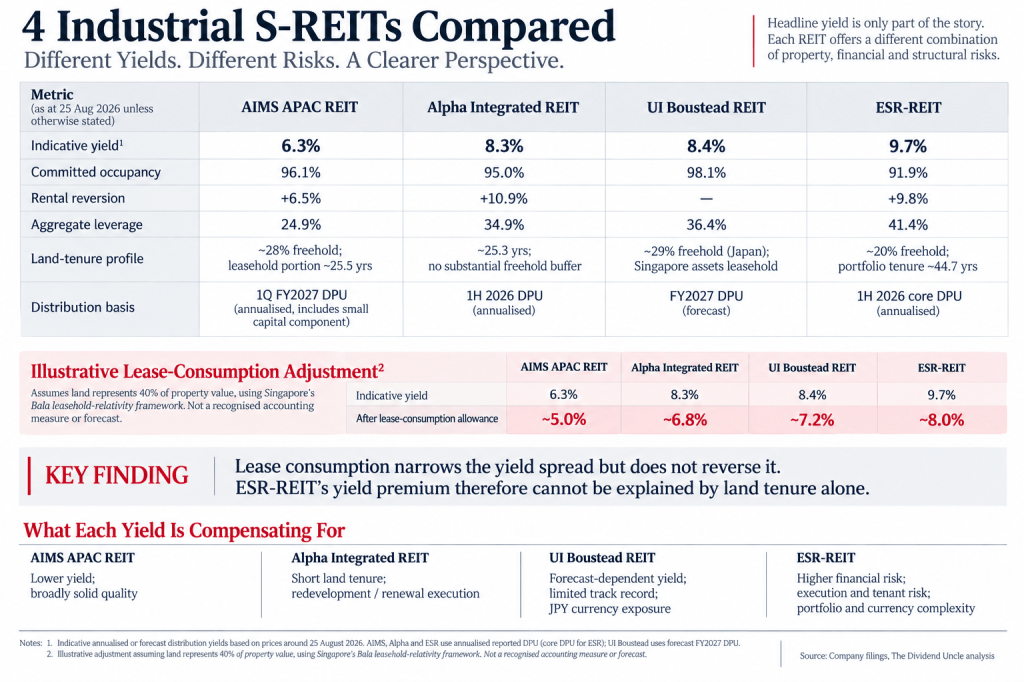
AIMS APAC REIT (SGX: O5RU), Alpha Integrated REIT (SGX: M1GU), UI Boustead REIT (SGX: UIBU) and ESR-REIT (SGX: 9A4U) offered indicative annualised or forecast distribution yields ranging from approximately 6.3% to 9.7% based on prices around late August 2026. Yet current operating performance alone does not explain this unusually wide spread: three of the four report occupancy of at least 95%, while rental reversions remain positive where disclosed.
The larger differences lie in land tenure, financial structure, distribution visibility and portfolio complexity. An illustrative lease-consumption adjustment narrows the yield spread but does not reverse it. Most notably, ESR-REIT retains the highest indicative yield despite a relatively better land-tenure profile, suggesting that financial and execution risks are more important drivers of its yield premium.
The Yield Gap Is Wider Than the Operating Gap
Current operating performance does not explain the full yield dispersion. AIMS, Alpha and UI Boustead all report committed or portfolio occupancy of at least 95%, while Alpha’s 10.9% rental reversion is stronger than AIMS’ 6.5%. ESR-REIT is the main operating outlier: occupancy is lower at 91.9%, while the recent ACFS tenant event introduces additional income uncertainty despite positive rental reversions of 9.8%.
| Metric | AIMS APAC | Alpha Integrated | UI Boustead | ESR-REIT |
|---|---|---|---|---|
| Indicative yield* | 6.3% | 8.3% | 8.4% | 9.7% |
| Occupancy | 96.1% | 95.0% | 98.1% | 91.9% |
| Rental reversion | +6.5% | +10.9% | — | +9.8% |
| Aggregate leverage | 24.9% | 34.9% | 36.4% | 41.4% |
*Indicative annualised or forecast distribution yields based on prices around 25 August 2026. AIMS, Alpha and ESR use annualised reported DPU, with core DPU used for ESR; UI Boustead uses forecast FY2027 DPU.
Alpha is particularly notable because its 8%-plus yield is not accompanied by obvious operating distress. Committed occupancy reached 95%, NPI increased 10.8% year on year and rental reversions were 10.9%. AIMS also remains operationally healthy, with NPI up 12.5%.
ESR-REIT presents a more demanding picture. ACFS Port Logistics and a related entity, accounting for approximately 5.2% of effective gross rent at June, defaulted on rental payments and entered administration. Bank guarantees cover most accumulated arrears, limiting the immediate cash exposure, but future occupancy and reletting are more consequential for distribution visibility.
The central question is therefore not simply why one REIT yields more than another, but what additional risk investors are being compensated for.
Land Tenure Is the Clearest Structural Difference
Industrial REIT distributions can obscure an important economic characteristic: leasehold land is progressively consumed even when occupancy, rents and DPU remain healthy.
Alpha has the clearest structural weakness. Its weighted average remaining land tenure was approximately 25.3 years at end-2025, without a substantial freehold portfolio to provide an offset. AIMS has around 28% freehold exposure, although its leasehold portion itself has a weighted remaining tenure of only approximately 25.5 years.
UI Boustead has greater protection through its two freehold Japanese properties, representing roughly 29% of portfolio value, although its Singapore properties remain leasehold. ESR-REIT is more durable than its headline yield might imply: around one-fifth of the portfolio was freehold and valuation-weighted remaining tenure was approximately 45 years around the June reporting period.
This distinction matters because a higher cash distribution from a short-lease portfolio is not economically identical to the same distribution from a longer-duration or freehold portfolio.
An Illustrative Lease-Consumption Adjustment
To make the effect more explicit, an illustrative exercise assumes that land represents 40% of property value and uses Singapore’s Bala leasehold-relativity framework as a standardised proxy for annual lease consumption. The estimated annual consumption is expressed relative to market capitalisation so that it can be compared with distribution yield.
| REIT | Indicative yield | After lease-consumption allowance |
|---|---|---|
| AIMS APAC | 6.3% | ~5.0% |
| Alpha Integrated | 8.3% | ~6.8% |
| UI Boustead | 8.4% | ~7.2% |
| ESR-REIT | 9.7% | ~8.0% |
This is an illustrative comparison tool, not a recognised accounting measure, estimate of “true yield” or forecast of property prices. Different assumptions would produce different absolute results.
The relative result is more useful: the yield gaps narrow, but the ranking does not reverse. In particular, short land tenure alone does not explain ESR-REIT’s yield premium.
Financial Risk Explains More of the Yield Dispersion
Balance-sheet comparison provides a clearer explanation for some of the remaining spread.
AIMS’ reported gearing of 24.9% is comfortably the lowest, but the comparison is complicated by perpetual securities, which are classified as equity rather than debt. Its interest coverage was 4.9 times before perpetual-security distributions but 2.7 times after including them. The REIT therefore remains financially conservative, but the headline gearing figure overstates the difference relative to peers if viewed in isolation.
Alpha and UI Boustead occupy a relatively comfortable middle ground. Alpha reported 34.9% gearing, 3.76% financing cost and 4.2 times interest coverage. UI Boustead’s gearing was higher at 36.4%, but borrowing cost was approximately 2.5%, interest coverage roughly five times, with no major refinancing requirement until FY2029.
ESR-REIT stands apart. Gearing was approximately 41% at June, interest coverage was around 2.6 times and perpetual securities add another layer of economic financing exposure. Deleveraging through asset recycling and debt repayment is positive, but the current financing burden remains materially heavier.
This helps explain why ESR-REIT can retain a substantial yield premium even after adjusting conceptually for land tenure.
An 8% Yield Can Still Mean Different Things
Alpha and UI Boustead illustrate another problem with headline comparisons: almost identical yields can have different evidential foundations.
Alpha’s approximately 8.3% indicative yield annualises actual 1H 2026 DPU. UI Boustead’s approximately 8.4% figure instead relies on forecast FY2027 DPU because the REIT has only a short listed history. Its maiden operating update reported NPI 4.3% below the prorated IPO forecast, partly due to the weaker Japanese yen and delayed lease commencement at one Japanese property, although this does not establish that full-year DPU will miss forecast.
AIMS’ yield annualises its latest quarterly DPU, which includes a small capital component. For ESR-REIT, using core rather than total DPU removes its capital distribution from the comparison, although the ACFS tenant event creates additional forward uncertainty.
Portfolio complexity adds another distinction. Alpha is entirely Singapore-focused. AIMS has Australian exposure but uses AUD borrowings and currency forwards as part of its hedging framework. UI Boustead has meaningful JPY exposure through its Japanese assets, while ESR-REIT spans Singapore, Australia and Japan and combines currency exposure with ongoing acquisitions, divestments and asset enhancement initiatives.
The comparison therefore becomes less about finding the highest yield and more about identifying the particular risk embedded within each yield.
Key Risks & Mitigating Factors
- AIMS APAC REIT — quality versus yield: healthy operations and substantial financial flexibility support the portfolio, but the significantly lower yield is not accompanied by an obviously superior leasehold profile. Its freehold exposure provides some mitigation.
- Alpha Integrated REIT — short land tenure: approximately 25 years of weighted remaining tenure is a genuine structural weakness. Strong current operations, moderate leverage and redevelopment or intensification potential provide offsets, but do not eliminate lease decay.
- UI Boustead REIT — forecast delivery: freehold Japanese assets and comfortable financing improve the structural profile, while the principal uncertainty is the limited listed track record and reliance on forecast DPU. JPY exposure adds another variable.
- ESR-REIT — financial and execution burden: higher gearing, perpetual securities, lower occupancy and the ACFS tenant situation create the greatest combined risk load. Deleveraging and portfolio recycling could progressively improve this profile.
The Dividend Uncle Research View
The 6%–10% yield range across these four industrial S-REITs is better understood as compensation for different risks, rather than as a simple ranking of income attractiveness.
AIMS offers relatively solid operating quality and financial flexibility, but at a substantial yield discount. UI Boustead combines better portfolio-duration characteristics with less-established distribution evidence. ESR-REIT retains the largest yield premium even after allowing illustratively for lease consumption, but that premium accompanies the heaviest financial and execution burden.
Alpha presents perhaps the most concentrated trade-off. Its land tenure is clearly weak, but current operations, financing simplicity, distribution visibility and lack of foreign-currency complexity are comparatively strong. The key issue is whether redevelopment, intensification and eventual portfolio recycling can extract sufficient economic value from the remaining leases or progressively improve portfolio duration. On this framework, land-tenure execution is the principal variable to monitor rather than current operating performance.
How This Analysis Fits Within a Broader Research Framework
This article forms part of an ongoing research series examining Singapore-listed REITs and income-oriented investments through the lens of asset quality, income sustainability, capital discipline, and portfolio role. The objective is to provide structured, long-term analysis rather than commentary on short-term price movements.
Related Research
• Singapore REITs 2026 Guide
• Core–Satellite REIT Portfolio Framework
• Dividend Investing & Income ETFs — Structural Overview
Publication note: This article is intended for educational and informational purposes and reflects publicly available information as at the date of publication.
 The Dividend Uncle
Leave a comment