
Executive Summary
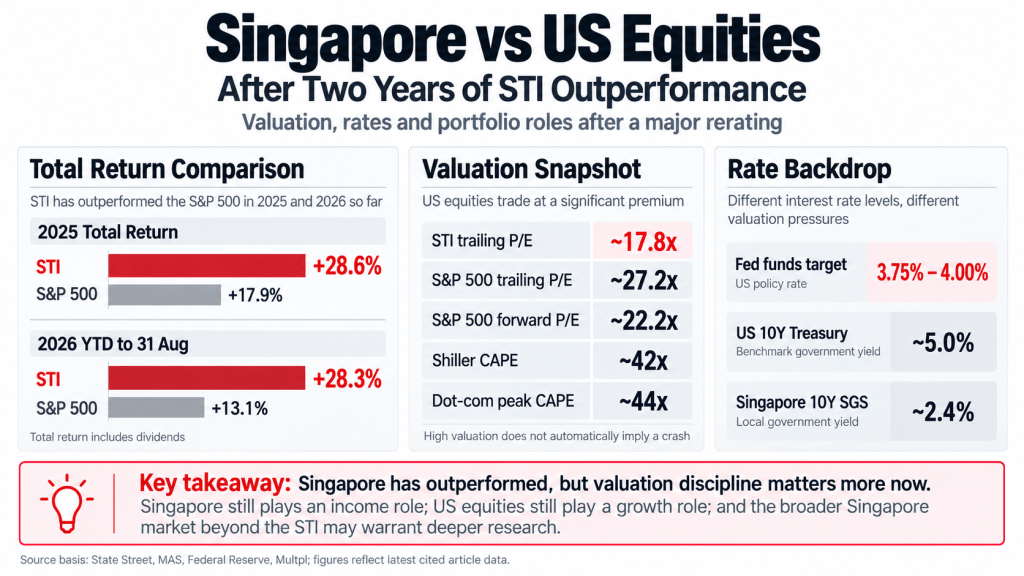
Singapore equities have materially outperformed the US market across 2025 and 2026 year-to-date. The STI delivered a 28.57% total return in 2025 versus 17.88% for the S&P 500, followed by a further 28.29% through August 2026 versus 13.14% for the S&P 500. The divergence reflects both dividends and a substantial rerating of Singapore equities, particularly the banks.
The implication is not simply that Singapore is now preferable to the US. Singapore valuations have risen, the STI remains highly concentrated, and US equities retain stronger structural growth exposure despite demanding valuations. The more relevant distinction is between portfolio roles, balance-sheet resilience and where valuation support remains strongest.
Two Years of Outperformance Have Changed the Starting Point
Singapore’s recent performance is notable because the comparison remains strong even after accounting for US dividends. The STI’s 28.57% total return in 2025 exceeded the S&P 500’s 17.88%; through 31 August 2026, the respective total returns were 28.29% and 13.14%.
| Metric | Singapore | United States |
|---|---|---|
| 2025 total return | STI +28.57% | S&P 500 +17.88% |
| 2026 YTD to 31 Aug | STI +28.29% | S&P 500 +13.14% |
| Dominant sector | Financials 61.35% | Information Technology 38.28% |
| Largest concentration | DBS + OCBC + UOB ~57.6% | More diversified across mega-cap growth leaders |
| 10-year government yield, 22 Sep | SGS 2.41% | Treasury 4.96% |
Sources: State Street, SGX-related benchmark reporting, MAS and Federal Reserve/Treasury data.
The important analytical point is that this is not merely an income effect. Price appreciation has contributed substantially, which means Singapore has undergone a genuine rerating.
That makes the forward-looking question harder. A market that was previously cheap can become less attractive without becoming objectively expensive. Once valuation moves from depressed towards fairer levels, future returns increasingly depend on earnings growth, dividends and business execution rather than further multiple expansion.
The STI Rerating Is Real — and Highly Concentrated
The STI’s strength needs to be interpreted in the context of its structure. As of early August, DBS represented about 29.2% of the index, OCBC 18.5% and UOB 9.9%. Together, the three banks accounted for roughly 57.6% of the STI, while financials overall represented 61.35%. Technology was only 0.86%.
This concentration matters because “Singapore equities” and “the STI” are not synonymous. Recent index performance has been heavily influenced by the profitability and rerating of the banking sector.
The rerating is not unsupported. The banks have continued to generate strong earnings while broadening their profit engines beyond net interest income. That is important because the earlier phase of the bank cycle benefited significantly from high rates and elevated net interest margins. As Singapore rates softened, wealth management, fees and other non-interest businesses became more important.
The structural strength is therefore real, but so is the valuation reset. Investors are no longer being compensated by the same degree of pessimism that characterised earlier periods.
Singapore Is Cheaper, but the US Growth Premium Still Has a Basis
Headline valuation comparisons require care because index providers may calculate earnings multiples using different methodologies and dates.
State Street reported the STI ETF at 17.83 times earnings on 7 August, calculated using the previous 12 months’ earnings. Its S&P 500 Singapore-listed ETF showed an index P/E of 24.84 times on 9 September, based on forecast fiscal-year earnings. These figures should therefore not be treated as a perfectly like-for-like spread.
The broader conclusion remains clearer than the precise multiple difference: Singapore has rerated, but US equities still carry a much larger valuation burden.
The Shiller CAPE provides additional long-term context. It stood at 42.39 in early August 2026, compared with a historical dot-com-era peak of 44.19 in December 1999.
That does not constitute a short-term market signal. Elevated CAPE readings can persist for long periods, especially when earnings growth remains strong. The present S&P 500 also contains highly profitable, cash-generative global businesses that differ materially from many speculative technology companies of the late 1990s.
The more defensible conclusion is that elevated valuation reduces the margin for disappointment. The higher the multiple, the more important earnings delivery becomes.
The Fed Has Raised the Hurdle Rate — Singapore’s Backdrop Is Different
The Federal Reserve raised its target range by 25 basis points to 3.75%–4.00% on 16 September, citing still-elevated inflation.
Longer-term rates are even more relevant for equity valuation. The US 10-year Treasury yield was 4.96% on 22 September. By comparison, Singapore’s benchmark 10-year SGS yield was approximately 2.41%.
This divergence changes the relative hurdle rate facing equities.
In the US, a near-5% government bond yield increases the return investors can obtain without taking equity risk. High equity valuations therefore require stronger justification from future earnings and cash flows.
Singapore operates under a different monetary framework. MAS manages monetary conditions primarily through the exchange rate rather than a conventional policy-rate target. Monetary Authority of Singapore Singapore rates are still influenced by global conditions, but they do not have to move one-for-one with the Federal Reserve.
For rate-sensitive Singapore assets, that is a relative advantage as long as the divergence persists. It should not, however, be mistaken for protection against global financial conditions.
Higher Rates Increase the Value of Balance-Sheet Discipline
The rate backdrop is particularly relevant for REITs and leveraged companies.
A lower domestic rate environment can support refinancing economics, but leverage remains a fundamental risk variable. For income assets, headline yield should be assessed alongside gearing, interest coverage, fixed or hedged debt, refinancing schedules and the ability of rental or earnings growth to offset financing pressure.
This distinction matters because two securities offering similar yields can carry very different financial risks. A business with strong operating cash flow and well-laddered debt has a different sensitivity to rates from one whose distribution depends on sustained leverage and favourable refinancing.
The same discipline applies to US growth companies. “Technology” should not be treated as a uniform rate-insensitive category. Higher discount rates can be particularly relevant to long-duration growth assets. The more resilient cases are typically businesses where current profitability, cash generation and balance-sheet strength can offset part of that valuation pressure.
Singapore’s Opportunity Set Is Broader Than the STI
The recent STI rally also strengthens the case for looking beyond the headline index.
SGX’s iEdge Singapore Next 50 universe represented more than S$107 billion of combined market capitalisation as of 31 August 2026. The indices are designed to cover the next cohort of 50 companies outside Singapore’s 30 largest listed companies.
This does not imply that smaller or mid-sized companies are automatically undervalued. Lower liquidity, thinner research coverage, customer concentration, weaker funding access and company-specific execution risk can all justify valuation discounts.
The potential research opportunity is instead one of dispersion. If the most prominent large caps have rerated substantially, less-covered companies may offer different earnings drivers and valuation setups. The appropriate screen becomes stricter rather than looser: reasonable valuation, sound balance sheets, sustainable cash generation, dividend durability and identifiable business catalysts.
Key Risks & Mitigating Factors
- Singapore rerating risk: Further multiple expansion may be harder after two strong years. Strong bank earnings and dividends provide support, but future returns increasingly require operating delivery.
- US valuation risk: Elevated CAPE and high bond yields reduce the margin for earnings disappointment. Strong structural growth and high corporate profitability partially mitigate this risk.
- Rate convergence risk: Singapore’s relatively lower yields may not persist indefinitely. Balance-sheet quality and refinancing schedules remain important even while local conditions are supportive.
- Index concentration: STI performance is heavily dependent on the banks. Broader Singapore exposure can diversify business drivers, but smaller companies introduce additional liquidity and execution risks.
The Dividend Uncle Research View
The Singapore-versus-US decision is better understood as a portfolio-role question than a winner-versus-loser comparison. Singapore remains structurally stronger for income, SGD exposure and established cash-generative businesses, while US equities provide much broader exposure to technology, innovation and global growth.
After Singapore’s rerating and the Fed’s renewed tightening, selectivity matters more on both sides. US growth increasingly needs earnings to justify valuation; Singapore income increasingly requires discipline around leverage and price. The broader Singapore mid-cap universe is therefore worth deeper research, not because smaller companies are inherently superior, but because the opportunity set extends well beyond a bank-heavy STI.
How This Analysis Fits Within a Broader Research Framework
This article forms part of an ongoing research series examining Singapore-listed REITs and income-oriented investments through the lens of asset quality, income sustainability, capital discipline, and portfolio role. The objective is to provide structured, long-term analysis rather than commentary on short-term price movements.
Related Research
• Singapore REITs 2026 Guide
• Core–Satellite REIT Portfolio Framework
• Dividend Investing & Income ETFs — Structural Overview
Publication note: This article is intended for educational and informational purposes and reflects publicly available information as at the date of publication.


Leave a comment